UNIFI (UFI)·Q2 2026 Earnings Summary
UNIFI Posts 576% Gross Profit Surge as Cost Cuts Take Hold; Stock Jumps 5%
February 4, 2026 · by Fintool AI Agent
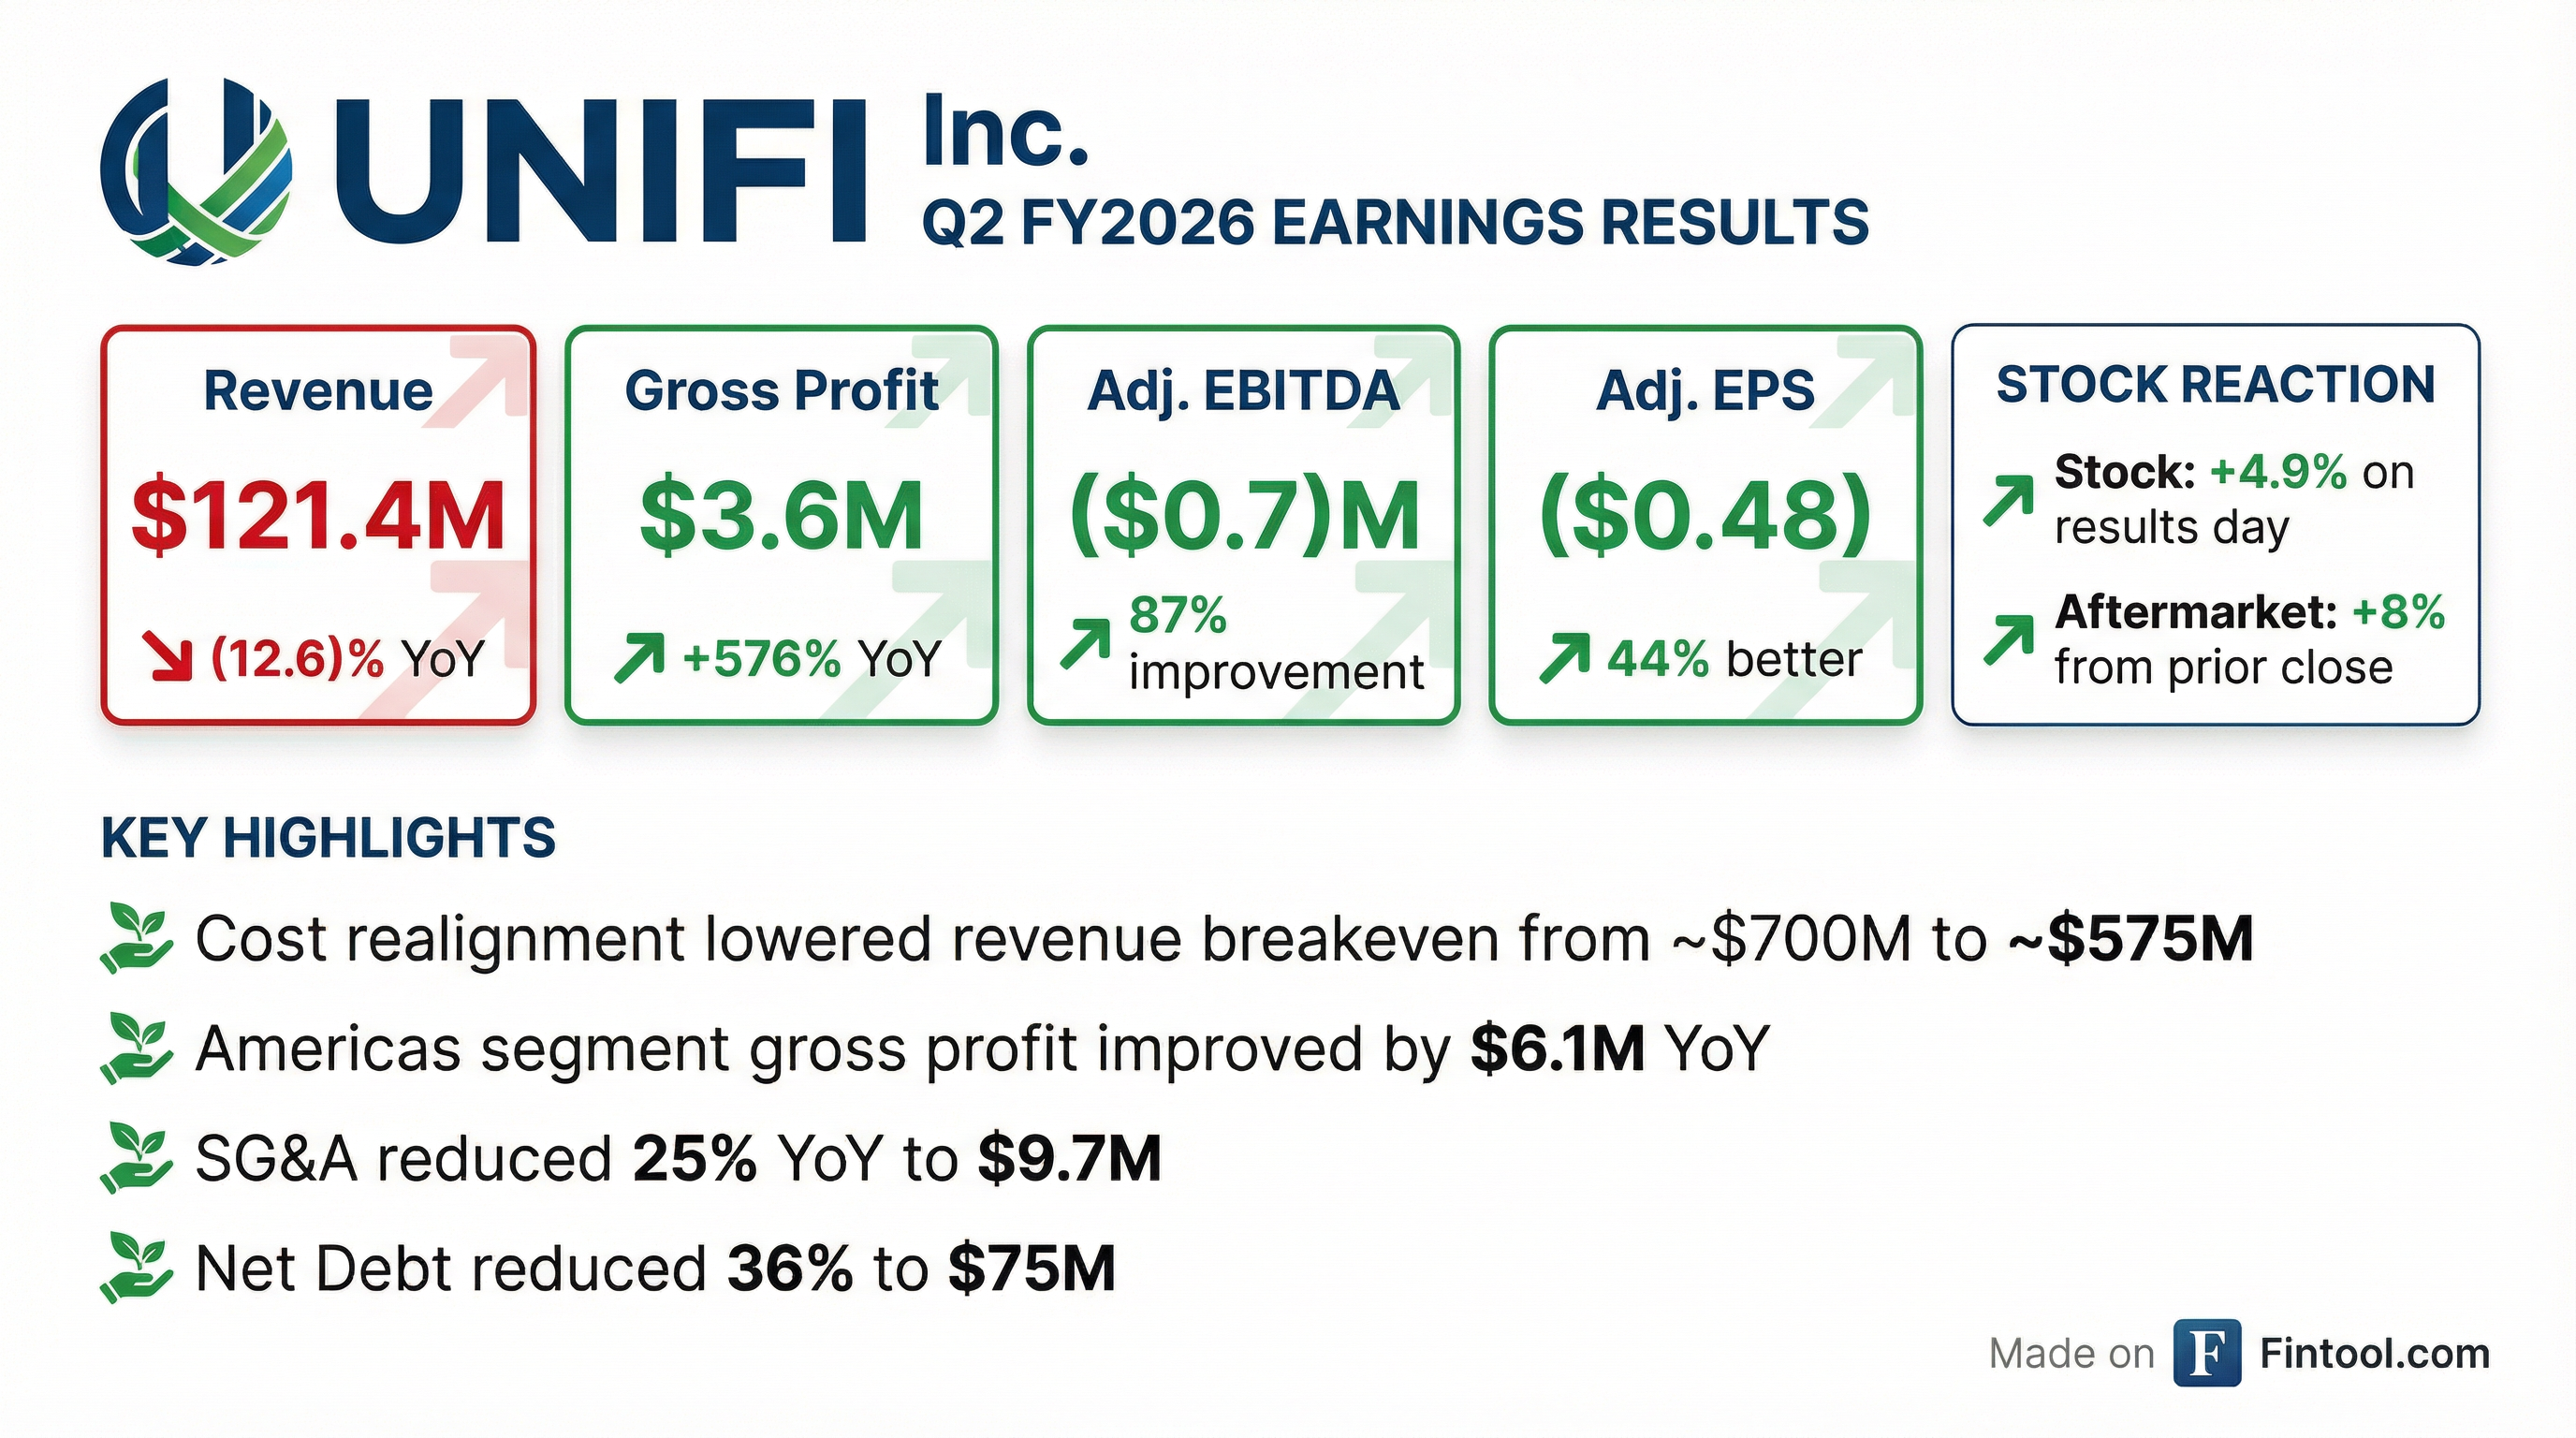
UNIFI, Inc. (NYSE: UFI), the maker of REPREVE recycled performance fibers, reported Q2 FY2026 results that showcased dramatic profitability improvements despite continued revenue pressure. While net sales declined 12.6% year-over-year to $121.4 million, the company's aggressive cost restructuring delivered a 576% surge in gross profit to $3.6 million and an 87% improvement in Adjusted EBITDA to $(0.7) million. The stock closed up 4.9% to $4.10 on the results, with aftermarket trading pushing gains to approximately 8% from the prior close.
Did UNIFI Beat Earnings?
Bottom line: Results in line with expectations, with dramatic profitability improvements. Management stated Q2 results were "in line with our expectations," and the market appears to agree given the positive stock reaction.
The turnaround story is clear: despite significant top-line headwinds from trade/tariff uncertainty, UNIFI's multi-year cost alignment efforts are finally delivering measurable results. Revenue breakeven has been reduced from ~$700M to ~$575M annually.
How Did the Stock React?
UFI stock responded positively to the earnings release, gaining 4.9% on February 3 to close at $4.10. Aftermarket trading pushed the stock to $4.26, representing an 8.7% gain from the prior day's close.
Context on the stock's trajectory:
- 52-week high: $6.30
- 52-week low: $2.96
- Current price represents ~35% below 52-week high but ~39% above 52-week low
- 50-day moving average: $3.57 (stock trading 15% above)
- 200-day moving average: $4.38 (stock trading 6% below)
The positive market reaction reflects investor appreciation for the company's operational turnaround progress, particularly the demonstration that cost cuts are translating to improved profitability even as revenue remains pressured.
What Changed From Last Quarter?
Key improvements vs. Q1 FY2026:
-
Cash flow inflection: Operating cash flow was $25.3M in Q2, compared to cash usage in previous quarters. Free cash flow reached $13.3M year-to-date, a $33.2M improvement from $(19.9)M in the year-ago period.
-
Balance sheet strengthening: Net Debt declined to $75M from $117M a year ago — a 35.5% reduction. Debt principal stands at $105.4M with $30.2M in cash.
-
Cost restructuring complete: The Q2 FY2026 Cost Restructuring Program (October-December 2025) included headcount reductions and lowered operating spend, generating $5M in annualized SG&A savings.
-
Early Q3 momentum: Management noted "Early Q3 results indicate a return to better ordering patterns, with improving customer engagement."
What's Happening in Each Segment?
Americas Segment — Turnaround in Progress
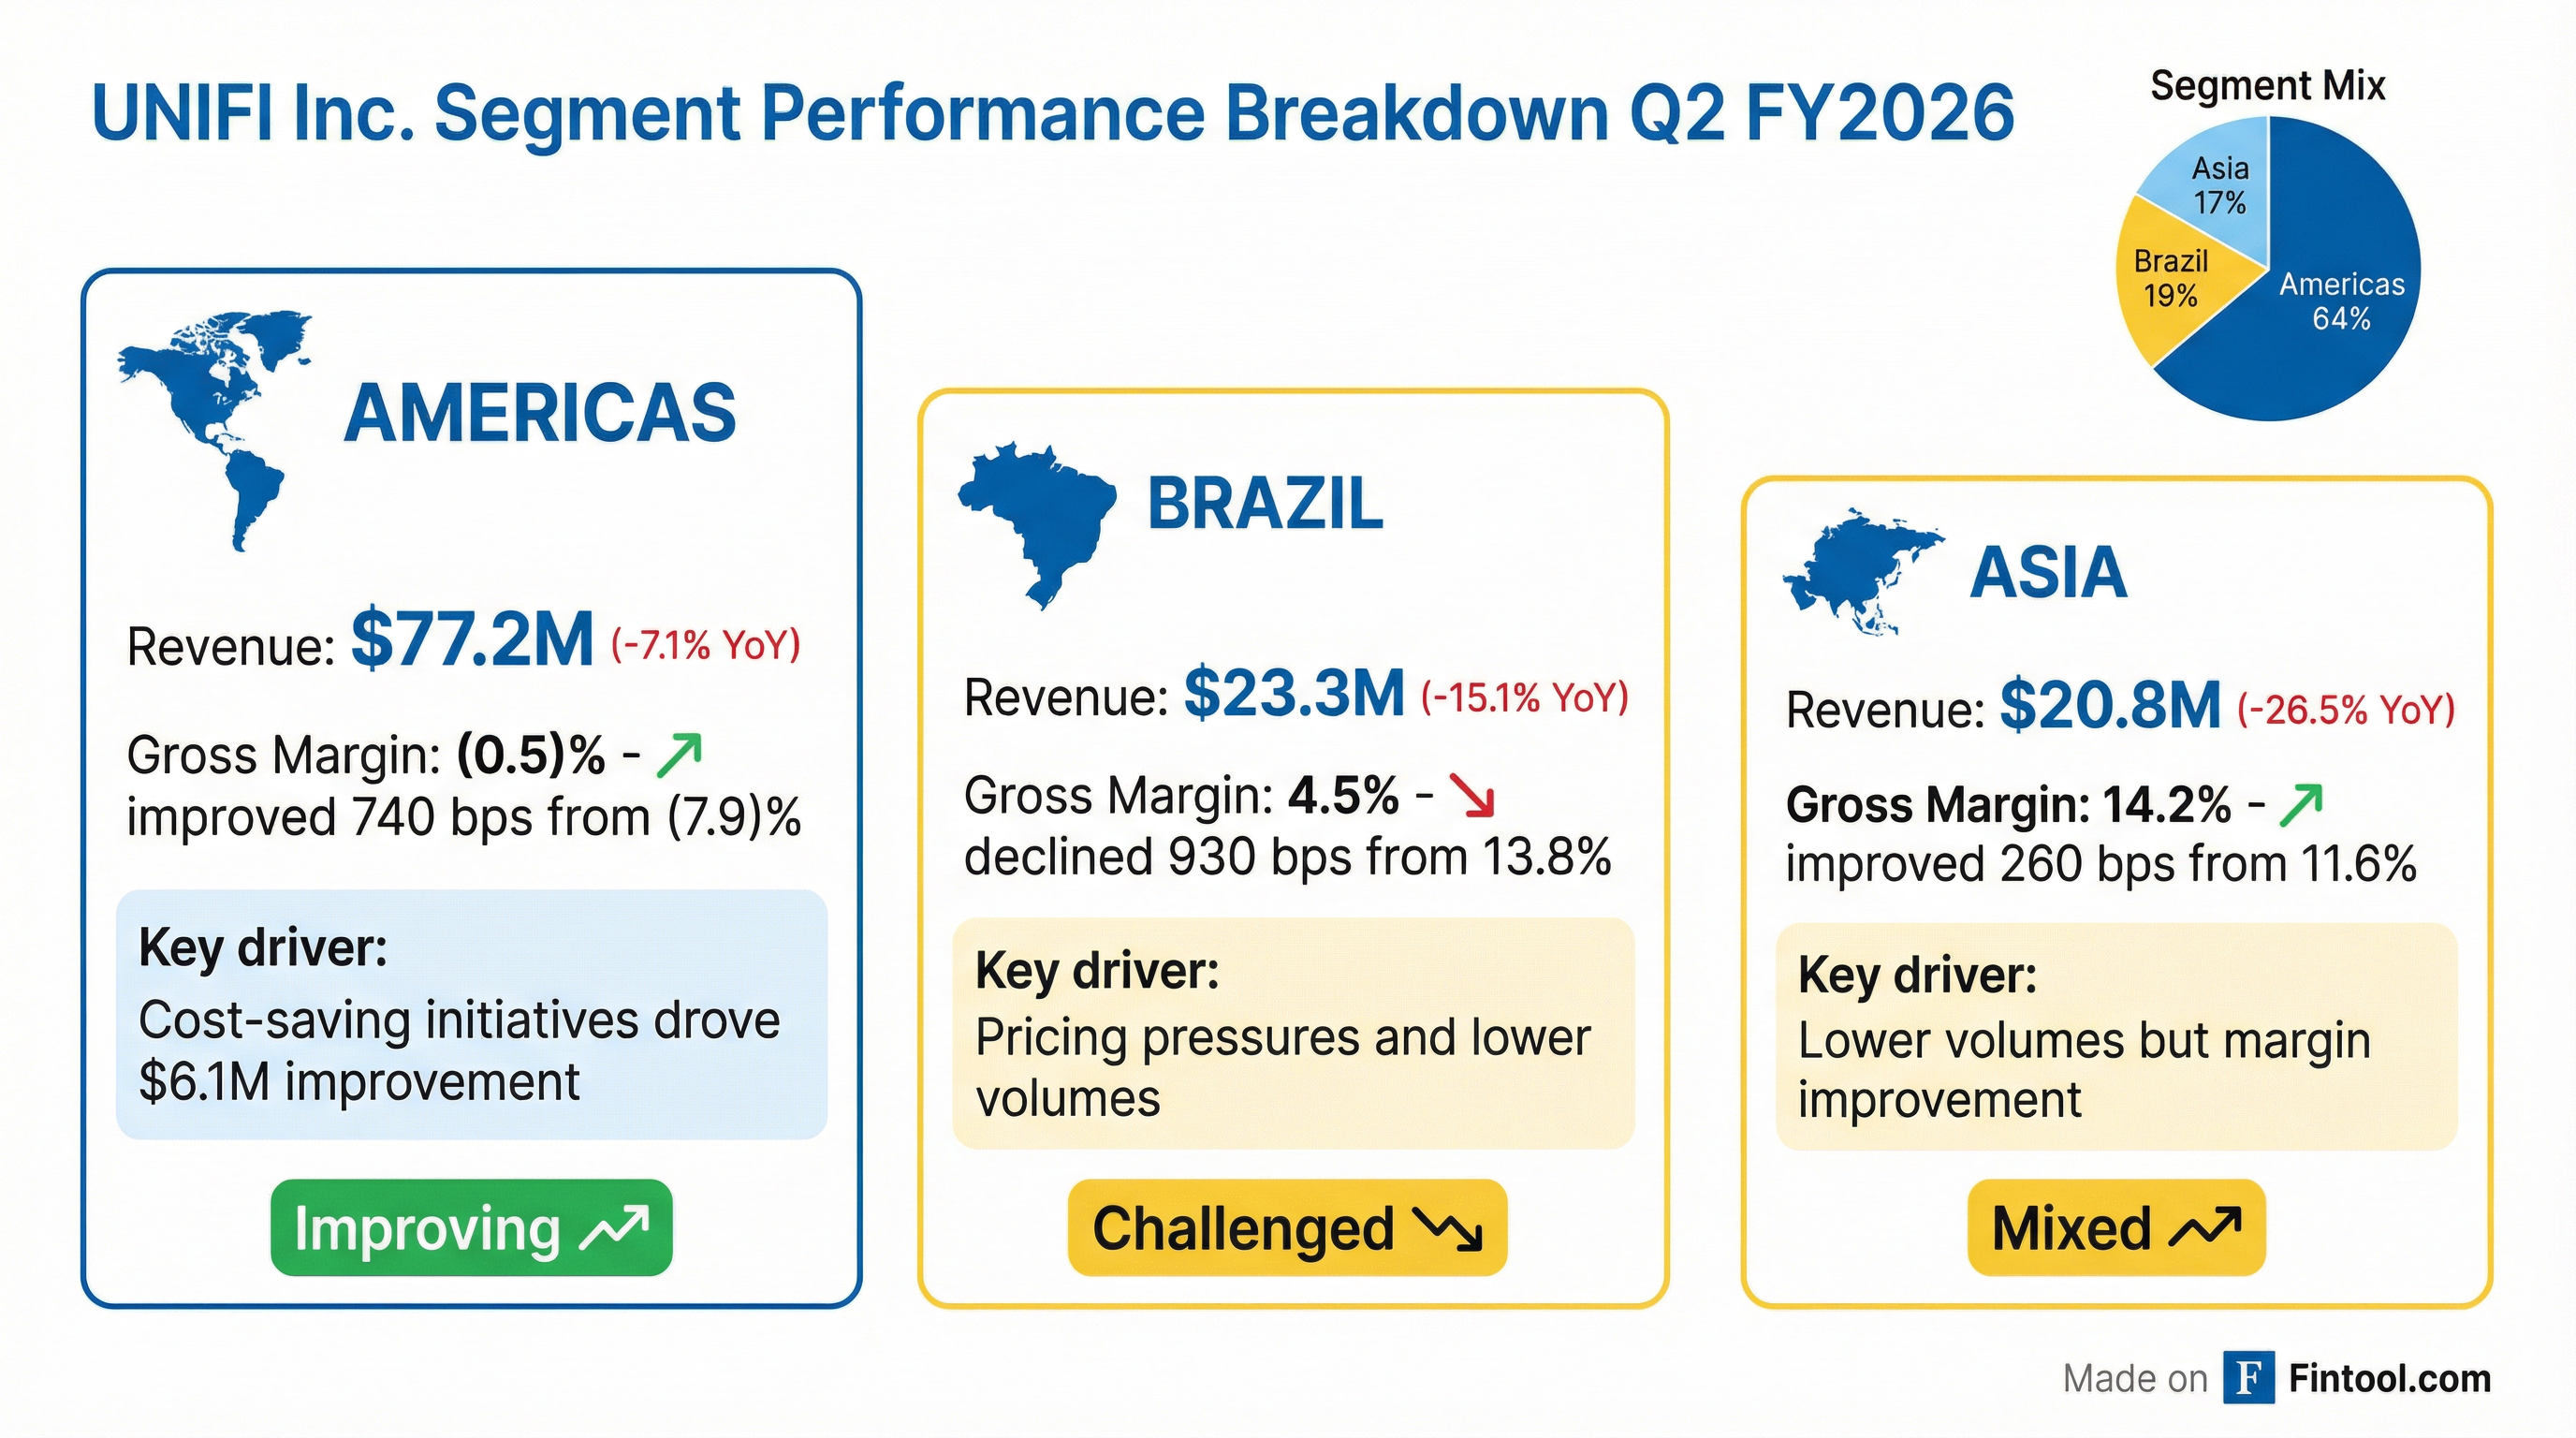
The Americas segment represents 64% of consolidated revenue and drove the majority of profitability improvement. Gross profit improved by $6.1 million year-over-year, primarily from multi-year cost alignment efforts including the consolidation of U.S. manufacturing operations.
Brazil Segment — Under Pressure
Brazil remains the most challenged segment, with import pricing pressures and lower sales volumes compressing margins significantly despite continued demand stability.
Asia Segment — Volume Decline, Margin Improvement
Asia saw the steepest revenue decline but maintained the highest gross margin of all segments. Despite the 26.5% sales drop, gross profit only declined 10% as margins expanded.
What Did Management Say?
Executive Chairman Al Carey on the turnaround:
"I'm happy to report that we're beginning to see results in our business that are coming from a major effort that began one year ago, which is essentially resetting our cost base in North America business. The closing of the Madison facility and the reduction of costs across the board have created clear operating improvements that are going to allow us to make healthy profits on a much smaller sales level."
CEO Eddie Ingle on operational progress:
"Over the past two years, we've executed three strategic initiatives that have helped us better align our cost structures and operations... As a result of this program, we will see reduced operating spend and a $4 million in SG&A savings all being reflected in fiscal year 2026."
On early Q3 trends:
"While we're only a few weeks into the third quarter of our fiscal 2026, we are also starting to see some initial signs of an improved operating environment driven by increased customer engagement, and many of them are beginning the post-holiday restocking."
On the path forward:
"We recognize that there is still important work needed to sustain the recent successes as we move towards our long-term objectives. That said, we are encouraged by the progress we've made to date. We are one money to the second half of our fiscal 2026, and our focus remains on converting our operational improvements into sustained financial momentum and ultimately creating long-term value for our shareholders."
What Are the Key Strategic Initiatives?
Cost Realignment Summary
UNIFI has executed three major cost initiatives since FY2024:
The combined effect: Revenue breakeven reduced from ~$700M to ~$575M — meaning UNIFI can now reach GAAP operating breakeven on ~18% less revenue than before.
Innovation Pipeline
UNIFI continues to invest in product innovation through its REPREVE brand:
- Integr8™ - Performance-enhancing filament yarn
- REPREVE with CiCLO® Technology - Biodegradable recycled polyester & nylon
- Fortisyn™ - Durable yarn for military and tactical gear
- ThermaLoop™ - Down-like fiber insulation
- REPREVE Takeback White Filament Yarn - Dyeable, high-performance polyester
REPREVE Fiber products represented 28% of net sales ($34.3M) in Q2, down from 31% ($43.3M) in the prior year period.
What Are the Key Risks?
-
Revenue trajectory remains uncertain: Sales declined 12.6% YoY with all three segments contracting. Tariff uncertainty and trade policy continue to pressure demand.
-
Brazil margin compression: The 930 bps gross margin decline in Brazil suggests competitive/pricing pressures that may persist.
-
Working capital rebuild: Management expects Q3 operating cash flows to be lower as working capital increases to support anticipated sales growth.
-
REPREVE market share: REPREVE sales as a percentage of total revenue declined from 31% to 28%, which may indicate competitive pressure in the recycled fiber market.
Forward Catalysts
- Q3 FY2026 results — Expected late April/early May 2026; management sees early signs of demand improvement across all segments
- Central America tariff deals — El Salvador and Guatemala signed reciprocal tariff agreements enabling CAFTA-DR-like duty-free treatment for regional yarns
- Full calendar 2026 cost savings — $20M annual operating cost savings from U.S. manufacturing transition fully realized
- Military/tactical opportunity — Al Carey noted this segment "looks bigger than expected" with progress on testing and high-margin potential
- Beyond Apparel expansion — Strong packaging quarter, carpet growth, and continued military sampling point to diversification gains
Historical Performance Summary
*Q4 FY25 included gains from Madison, NC facility sale
Q&A Highlights
The earnings call featured questions from Anthony Lebiedzinski at Sidoti & Company covering demand trends, pricing dynamics, and the path to profitability.
On demand pickup since quarter-end:
Executive Chairman Al Carey noted encouraging early trends: "We've seen improvements in orders from many customers in early January, and we're cautiously optimistic about the recent order trends that we're seeing into February."
CEO Eddie Ingle confirmed demand is improving across all segments: "We're seeing it really across the board. Brazil's coming out of a holiday season, so there's de-stocking taking place, but also there's stimulation in the economy by the government... And then the U.S. and Central America, that's where it's shining because we are seeing the impact of the restocking of the inventories post everybody year-end."
On Central America tariff developments:
Management highlighted a significant positive catalyst: "Just last week, two countries in Central America, El Salvador and Guatemala, just signed reciprocal tariff deals with the U.S. government. This means that in the very near future, apparel made from regional yarns that are made in these two countries can once again receive CAFTA-DR-like duty-free treatments."
On Beyond Apparel progress:
Al Carey flagged military as an area to watch: "Watch military in the next couple of quarters. It looks like it's bigger than expected, and we're making a lot of progress with it. It just takes a long time to test for durability and colors, but when you get the business, it's usually a good long-term one and with high margins."
Eddie Ingle added: "Last quarter, we had a very, very strong quarter in the packaging sector. Carpet actually grew slightly also."
On pricing dynamics:
Management noted improving pricing trends across segments: "In Asia, it's a very reactionary market, and so there is a slight uptick... In particular, I wanted to circle back to the U.S. and Central America. We've done a lot of bottom-sizing in that business. We've tried to exit businesses that were very challenging from a pricing point of view. We've done targeted price increases... The margin improvement has been helped by, of course, all these restructuring we've done and the spend, the cost takeouts, but the pricing has been a big part of that."
On break-even segment distribution:
CFO AJ Eaker clarified how the $575M break-even revenue is distributed: "When we look at how that's distributed across the segments, you're looking at mid- to high-300s generally for the Americas, and then the other two segments filling in the gap really from some of their historical run rates... that would get you to a high single-digit gross margin for the consolidated entity and therefore break even on an operating income zero basis."
Holiday Season and Market Context
Al Carey provided color on the broader retail environment: "The holiday sales for apparel were what we would describe as solid, +4%. I wouldn't say they were great, but they weren't bad, and most of the retailers are satisfied with what they saw."
He explained the tariff-driven inventory dynamics: "You may recall back in about April-May timeframe last year, our revenues dropped precipitously, and that's when the reciprocal tariffs were placed in order. That created turmoil in apparel and textile supply chains, and most of the customers that we deal with placed large orders before the tariffs went into place... But it led to record inventory levels, and it slowed orders across the board in the industry for the entire balance of the calendar year, which was seven full months."
This analysis incorporates the 8-K filing and earnings presentation released February 3, 2026, plus the Q2 FY2026 earnings call held February 4, 2026.
Related Links: